Project Showcase: How to Insert a Graph in a Web Page Using HTML
Embedding interactive charts and tables to support blog content is a powerful SEO tactic that can help improve your site’s bounce rate and time on page, while adding additional relevant data to support your findings. There are not many tools out there you can utilize for this, and some are better than others. Here’s an example of charts we’ve created at ProSource for our local clients.
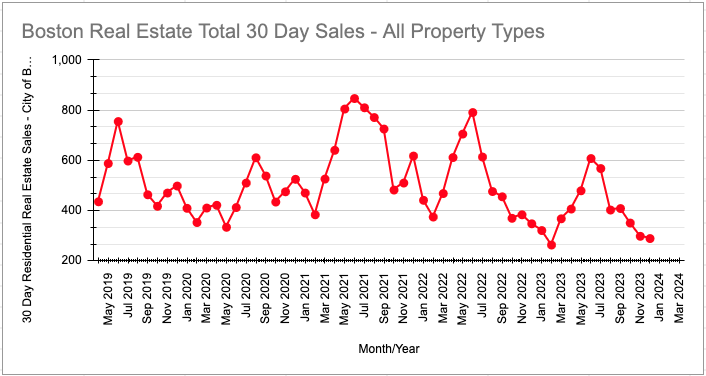
Using Zoho Analytics and Google Sheets, we took a daily stat email and fed it directly into Zoho Analytics via Google Sheets. This platform automatically import data tables into Zoho Analytics and create any type of chart or data representation you can think of with the data set. Here’s a sample of what an interactive html graph looks like:
All we had to do is create a template in Google Sheets to easily sort between the different neighborhoods in Boston, and then build a dashboard template in Zoho Analytics. Once these two were completed, we can easily import the Google Sheet for any town in Boston to get real-time apartment statistics for every micro-neighborhood in Boston within minutes.
As you can image, this is a treasure trove for great content ideas. ProSource Media manages the content strategy and SEO strategy for Boston Pads. We are utilizing these charts to create real-time Apartment Rental Market Reports for each neighborhood in the Greater Boston area. Here’s a complete list of the apartment market reports created thus far for reference:
- Back Bay Apartment Rental Market Report 2019
- Allston Apartment Rental Market Report 2019
- Brookline Apartment Rental Market Report 2019
- Average Rent Prices in Somerville 2019
- Average Rent Prices in Medford 2019

In so many cases, businesses under utilize the data they have. In this case, we were able to organize an immense database of apartments in Boston to create what your seeing here. This will be years of great content to come as a result, and Boston Pads will solidify itself as the local leader in apartment rentals in the Greater Boston Area.
Proud dad, husband, and Owner of ProSource Media. Zach is a golf pro, a self professed BBQ master, and an expert in SEM and digital strategy. He started ProSource Media in 2016, which has grown into a successful digital marketing agency with clients all over the United States.
View all posts by zach →